Project Background
The Fox Cities Performing Arts Center is a thriving nonprofit arts and entertainment venue in downtown Appleton, Wisconsin. Since it opened its doors in 2002, it has had over 2.6 million visitors for ticketed events, that’s an average of 173,333 ticketed visitors a year.
During the 2015-2016 season, the PAC generated 12.9 million dollars in economic activity. Fox Cities residents spent an average of $24.52 beyond their ticket price, and for out-of-town visitors, the number increased to $43.89.
Currently, 81% of adults in the United States report owning a smartphone. With knowledge of these statistics and the advancement of these trends, the use of smartphones and individual needs at entertainment facilities are also on the rise. Therefore, it is important to stay current with user needs and wants by offering convenient services through technology that promotes their overall experience.
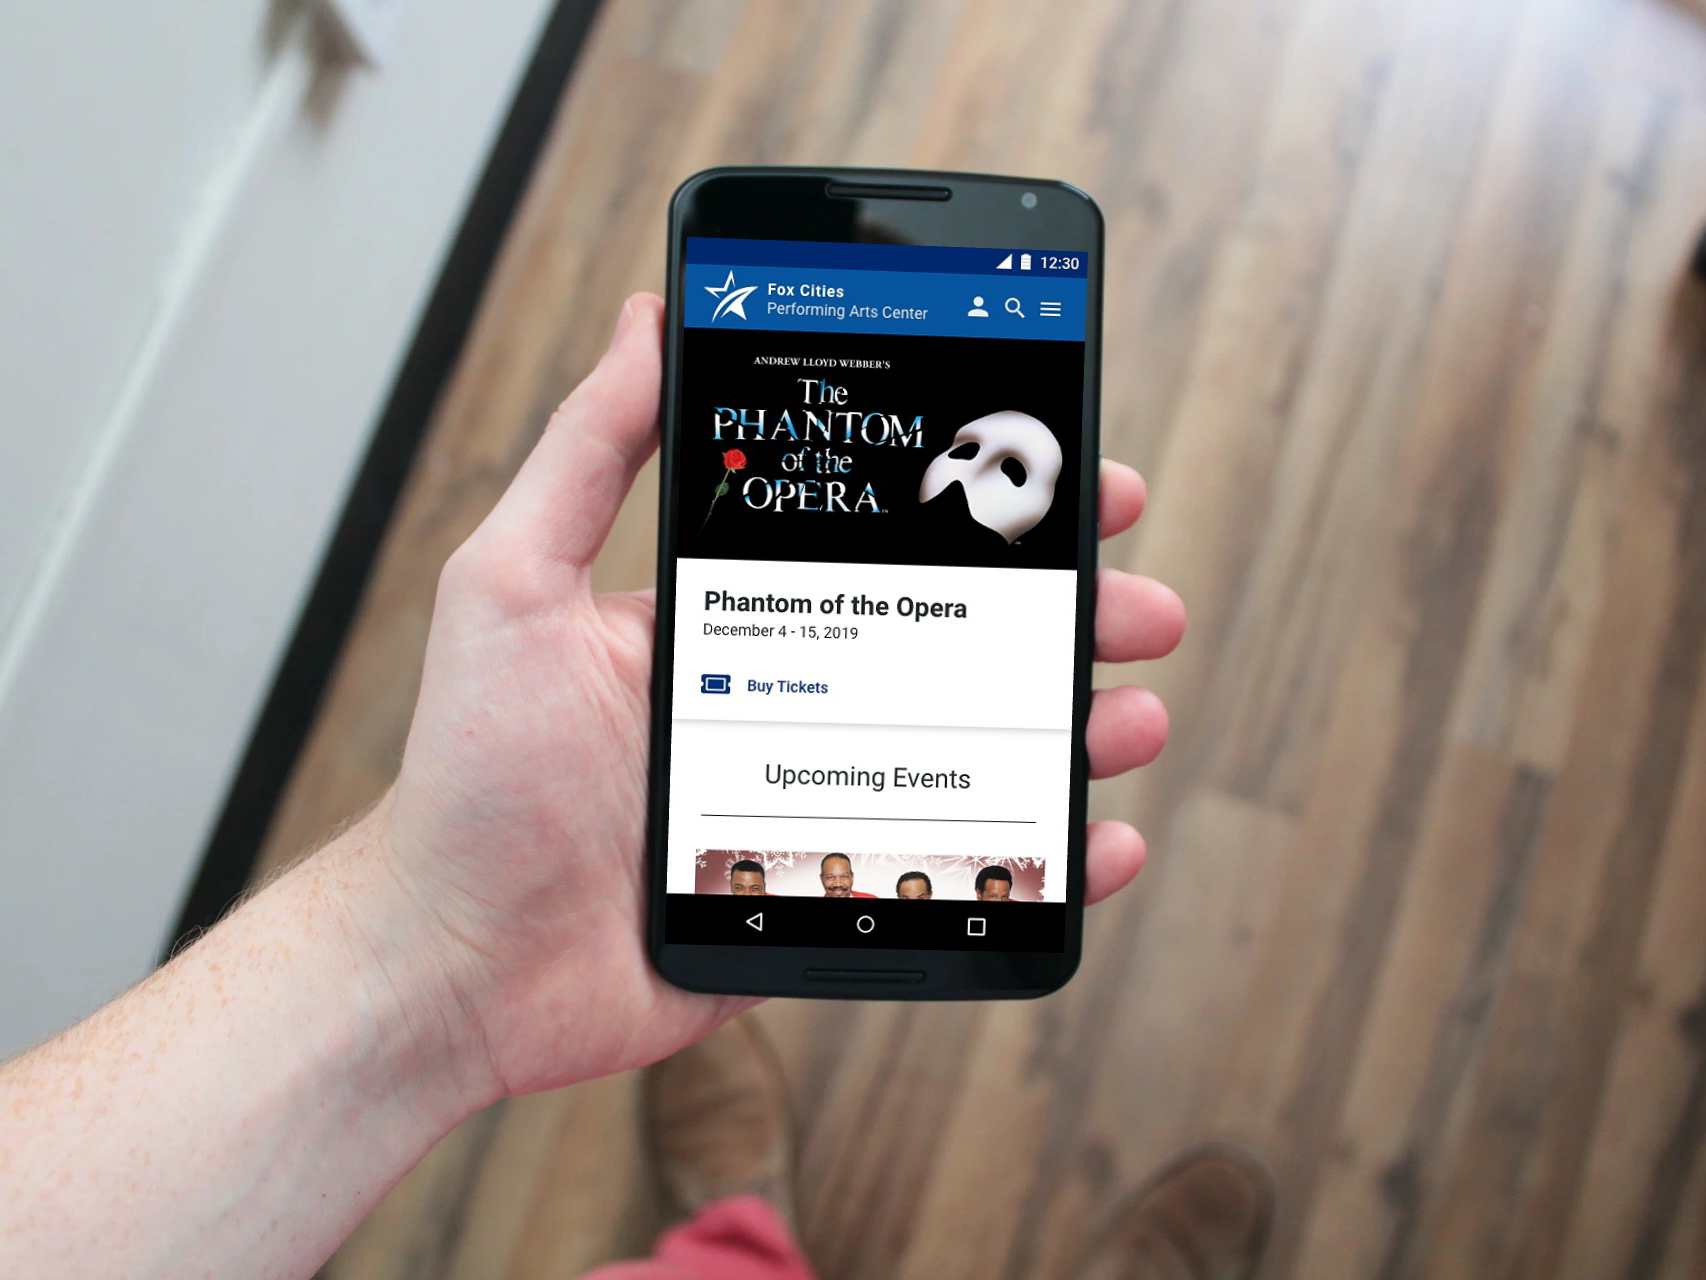
Because of these trends, I researched the potential need for further development of the PAC’s digital properties, specifically for mobile applications.
The Design Problem
Patrons of the Fox Cities Performing Arts Center have limited digital resources prior to and during live events to interact with the hosting venue and the overall entertainment experience.
Research Question
Would the development of an interactive mobile app optimize the user experience while attending a live event at the Fox Cities Performing Arts Center?
Background for the Research
I conducted user research for the Fox Cities Performing Arts Center in order to determine if a mobile app would be an appropriate addition to their digital services. The methods of research implemented during the process were one-on-one stakeholder interviews and a user survey.
The rationale for the Research
• Provided insight into how users think, act, and feel
• Validated assumptions based on hypotheses
• Prioritized features and functionality for the product
• Clarification of the user’s mental model of the product
• Validated assumptions based on hypotheses
• Prioritized features and functionality for the product
• Clarification of the user’s mental model of the product
Stakeholder Interviews
Interview Recruitment Method
Existing contacts were used to recruit interview participants. These contacts met the criteria of either being a PAC season ticket holder or PAC management. I interviewed two PAC stakeholders throughout the process in multiple interview sessions. The aim of the interviews was to better understand the potential needs and wants of PAC patrons while attending a live performance at the PAC. During each interview session, I took notes.
Interview Data Matrix
After gathering data from the interviews, I deconstructed and transformed the data through the use of an affinity map. I then summarized the data and aggregated it into a matrix. Finally, the matrix provided a synthesis of the data, which allowed me to form hypotheses and validate them.
User Surveys
Survey Recruitment Method
I compiled a list of candidates from existing contacts and provided referrals. I expected all candidates to meet the criteria for the target audience.
Survey Research and Analysis Method
Data gathered from stakeholder interviews informed the development of research questions for a structured 25-question user survey. To further the research, I sent the questions electronically to a curated list of 20 potential candidates expected to pass the user screener. 13 participants passed the screener and then completed the survey. Post survey, I deconstructed the data and then synthesized it through the use of a visual matrix.
Survey Participants
Survey Participant Requirements:
• 30 to 70 years of age
• Employed full-time
• College educated
• Both male and female
• Employed full-time
• College educated
• Both male and female
Frequency and Type of Entertainment
Survey participants had 37 planned events in the next 6 months (at the time of the survey).
Hypotheses Analysis and Key findings
I extracted eight hypotheses that had 100% stakeholder validation from the research. In order to determine the value of the hypotheses to the user data, the survey results were cross-tabulated to establish a value percentage. The user value was determined by the total percentage of very important and important answers calculated from a Likert scale.
Product Recommendations
The following product recommendations were derived from the validation of hypotheses. These hypotheses are validated as a result of PAC stakeholder input and user survey data.
Recommendation 1: The interactive mobile app needs to include a section that features restaurants in the area.
Recommendation 2: The interactive mobile app needs to include a section that provides information on available parking in the area.
Recommendation 3: The interactive mobile app needs to provide a guide, map, or compass that directs the user to their seat.
Recommendation 4: The interactive mobile app needs to include a section with available concessions that can be purchased and delivered to the patron’s seat.
Recommendation 5: The interactive mobile needs to provide clear and easy access to the Wi-Fi password. The password and instructions should also be posted clearly in the venue.
Recommendation 6: The interactive mobile app should include sections that feature bios and additional information on the talent performing.
Recommendation 7: The interactive mobile app should include a section that provides information on upcoming events at the venue.
Recommendation 8: The interactive mobile app needs to include a brief video or animated tutorial on how to use a mobile ticket on a phone.
Video Summary of Findings


